Diving Deeper into SCUBA... Science by Costantino Balestra & Peter Germonpré
Author:Costantino Balestra & Peter Germonpré
Language: eng
Format: epub
Publisher: Acrodacrolivres
Published: 2017-01-15T00:00:00+00:00
3. Application of circulating bubble screening recommendations, interest, limitations
After a dive, the desaturation process may last several hours with an estimated maximum rate of circulating bubbles occurring 30-40 minutes after surfacing. Continuous or repeated detections performed at intervals every few minutes are needed to estimate the whole bubble quantity and the maximal bubble grade. Furthermore, circulating bubble grade may vary over a very short time frame. An automated assessment method based on detecting and counting bubbles in real time would assist analysis and advances in this field are ongoing. Recordings must not exceed one minute in a resting diver to limit bias caused by the subject or the examiner.
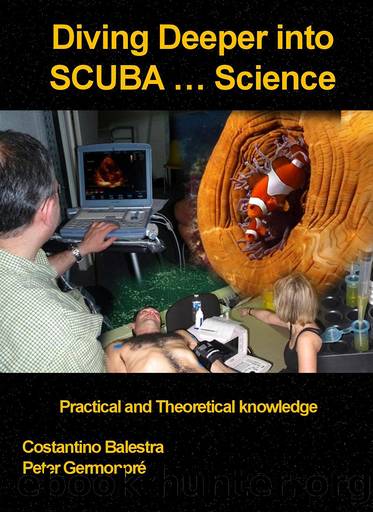
It is known that circulating bubbles can sometimes pass into the arterial circulation via a right-to-left shunt, such as a inter-atrial connection or pulmonary shunts. Consequently, an apical four-chamber view (see Figure 37 and Figure 38) and/or aortic blood flow recording should be systematically performed to detect circulating bubbles in the left (arterial) cavities. To improve the significance of the findings, the standard protocol is to record the explorations as a video file for later analysis by two independent investigators. Bubble grades provide only a semi-quantitative evaluation of the number of bubbles due to the categorical nature of the data. This means for example that âGrade 2â does not necessarily show twice as many bubbles as âGrade 1â and bubbles do not appear regularly in respect to time interval and quantity. Because of these limitations, a sort of linearization such as the Kisman Integrated Severity Score (KISS) has been proposed, where the results of three or four measurements at various time intervals are integrated into a single number. These mathematical methods facilitate the statistical treatment of these data but it should be kept in mind that they only provide an estimate of the circulating bubble production.
Since the 80âs, there have been quite a few studies that reported a correlation between detected bubble quantity and DCS. âMaximal observed bubble gradeâ has also been considered as an estimate for decompression stress. The interpretations of these studies are debated because correlations between high bubble grade and DCS risk are more frequently based on dry hyperbaric chamber dives and less frequently on real open sea diving. Furthermore, the clinical disorders reported in the chamber are mainly articular pain or cutaneous manifestations and the incidence of these disorders seems to be particularly elevated in comparison with real SCUBA diving. Finally, high bubble grades (bubbles throughout the cardiac cycle) are frequently observed in SCUBA divers without any clinical symptoms of DCS; and perhaps even more astonishing are recordings from asymptomatic divers which clearly show bubbles in the left cavities.
On the other hand, when only a few bubbles are detected during the whole desaturation period, the risk of DCS seems to be low - but not nil. Limits of the interpretation of circulating bubble detection are also supported by the studies in altitude chambers. Indeed, for a given exposure, women formed fewer nitrogen bubbles than men, but still seemed to have a higher incidence of altitude decompression sickness.
Download
This site does not store any files on its server. We only index and link to content provided by other sites. Please contact the content providers to delete copyright contents if any and email us, we'll remove relevant links or contents immediately.
| Electron Microscopes & Microscopy | Experiments & Projects |
| Measurement | Microscopes & Microsocopy |
| Scientific Instruments | Telescopes |
| Time | Methodology & Statistics |
Hands-On Genetic Algorithms with Python by Eyal Wirsansky (2020) by Unknown(4134)
Thing Explainer by Randall Munroe(3988)
The Elements by Theodore Gray(3122)
The Meaning of it All by Richard Feynman(2389)
Make by Mike Westerfield(2343)
Every Tool's a Hammer by Adam Savage(1988)
Science Experiments You Can Eat by Vicki Cobb(1908)
The Perfectionists by Sara Shepard(1846)
Martin Gardner's Science Magic by Martin Gardner(1760)
Raspberry Pi Electronics Projects for the Evil Genius (Tab) by Norris Donald & Norris Donald(1726)
Handbook of Modern Sensors by Jacob Fraden(1690)
Synchrotron Light Sources and Free-Electron Lasers by Eberhard J. Jaeschke Shaukat Khan Jochen R. Schneider & Jerome B. Hastings(1668)
Elephants on Acid by Boese Alex(1626)
Elephants on Acid: And Other Bizarre Experiments by Alex Boese(1609)
The Perfectionists by Simon Winchester(1595)
Tesla by Carlson W. Bernard(1552)
The Science of Food by Marty Jopson(1498)
The Meaning Of It All by Richard P. Feynman(1473)
125 Physics Projects for the Evil Genius by Silver Jerry(1471)
